Hello TBC’ers! This week we’ll be running through TBC’s International Roughness Index (IRI) report workflow. An IRI report is used to evaluate road pavement roughness and its impact on vehicle ride quality. The report helps identify sections of the alignment that may require corrective action to improve smoothness.
-
To begin this workflow, click on the “Point Clouds” tab on the top ribbon and then click “IRI Report” in the Measure group.

-
Select the Stationing Options parameters which include “from geometry” and “from reference.” The “from geometry” option uses the geometric properties of the alignment to determine stationing while the “from reference” option uses a reference alignment or a predefined stationing system to determine the stations that you may select. This setting also allows you to define post marker locations and values.

-
Select the point cloud region that you want to analyze by clicking on it in the Plan View or Project Explorer panes. The selection will be highlighted and listed in the point cloud region box.

-
Choose the search strategy you want the report to generate with. The options "Minimum," "Low Average," "Median," "High Average," and "Maximum" refer to different search strategies or methods for selecting and processing point cloud data to generate the IRI values. Depending on the chosen strategy, the resulting IRI values can highlight different aspects of the road surface, such as depressions, peaks, or a balanced profile.
-
Minimum: This option selects the minimum elevation point within the search radius around each station along the alignment.
-
Low Average: This option calculates the average of the lower elevation points within the search radius. It provides a smoothed profile that tends to highlight the lower surface features while still averaging out some of the noise.
-
Median: This option selects the median elevation point within the search radius. The median is the middle value when all points are sorted by elevation, providing a balanced profile that is less sensitive to extreme values.
-
High Average:This option calculates the average of the higher elevation points within the search radius. It provides a smoothed profile that tends to highlight the higher surface features while still averaging out some of the noise.
-
Maximum: This option selects the maximum elevation point within the search radius around each station along the alignment. It provides the highest possible surface profile, which might be useful for identifying the highest points or peaks in the road surface.

-
Choose the analysis type.
-
Overall: One IRI value is calculated over the entire run.
-
Continuous: IRI values are generated for each measurement in the .pav file.
-
Fixed Distance: IRI values are calculated across user-defined segment lengths. If using the Fixed Distance analysis type, specify the segment length over which the IRI will be calculated. This value determines the amount of data that is averaged.
-
Define the maximum acceptable IRI value for the pavement in the “Threshold” box. This threshold is used to evaluate the smoothness of the road surface and determine whether corrective actions are needed. When generating an IRI report, any IRI values that exceed this threshold indicate sections of the road that may require maintenance or improvements to enhance ride quality. It is set to 100 by default, but you may change this threshold to best meet your needs and specifications based on your dataset.
-
If you want to eliminate spikes from loose rocks on the surface you can check the "Apply Filter" box and specify the filter size.

-
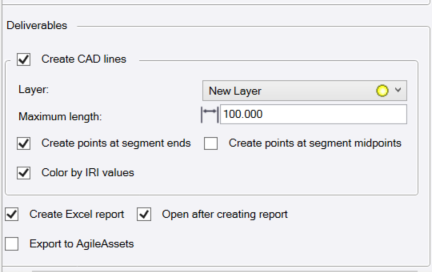
Select the deliverables you want the report to generate.
-
Run the report by clicking “Calculate” at the bottom of the pane. The report will display the IRI values as per the selected analysis type.
You're all set! Maximize your TBC experience and ensure smooth workflows by utilizing learning & support material most aligned with your needs and personal preferences.
For a demo of this particular workflow check our the TBC Youtube channel: https://www.youtube.com/watch?v=DbqF7HSEc8o
To download the latest version of TBC, you can head to https://geospatial.trimble.com/en/products/software/trimble-business-center/download
Complete free self-paced workflow-based courses with hands-on guided software experiences on Learn.Trimble: https://learn.trimble.com/pages/422/trimble-business-center-tbc