Trimble Business Center

 View Only
Expand all | Collapse all

Workaround for plot problems?

  • 1.  Workaround for plot problems?

    Posted 01-03-2019 19:26

    I have a problem with the plotting, sometimes and in some project it does not plot the things that is in the dynaview. I plot other things also. I know that this is a problem and that Trimble is working on a fix but i need a woraround (if it exsist).

    I have to send a customer a plot with c/f-maps and volumes but it doesent matter what i do i cant get it to work.

    If you look at the screenshots you can see that in TBC it is different C/F-maps in the drafting view but in the pdf after plotting its the same in both dynaviews. I cant send this to my customer, anybody know a workaround or a other way to do it?  


  • 2.  Re: Workaround for plot problems?

    Posted 01-04-2019 13:15

    Fred

    I am not sure what you are doing wrong here - so I built an example that appears to work for me at least - here is what I did - hope that these steps may help


    1. I built 3 surface models - Datum 100, Datum 103 and Slope Plane (Elev 95 on Left and 108 on right). All three were a square from 0,0 to 1000,1000 drawn as a rectangle and then elevated accordingly. The two Datum surfaces are flat planes at Elevation 100 and 103.
    2. I then drew a Dynaview Frame (a 4th rectangle from -10,-10 to 1010,1010).
    3. I then made surfaces for the two Datum Surfaces and the Slope plane surface
    4. I then created CF Maps for the Datum 100 to Slope Plane and Datum 103 to Slope Plane combinations.
    5. I then imported my Plot Sheet Template (I used Arch D sheet but this should not matter
    6. I then created View Filters for the displays I wanted - CF Map 1 and CF Map 2 - these showed the CF Map Surface, The Linework and the Cf Labels for the correct CF Map - the Labels for the two CF Maps were on different Layers.
    7. For steps 8&9 below I used the Mixed Sheet Sheet Set and created a Custom Sheet
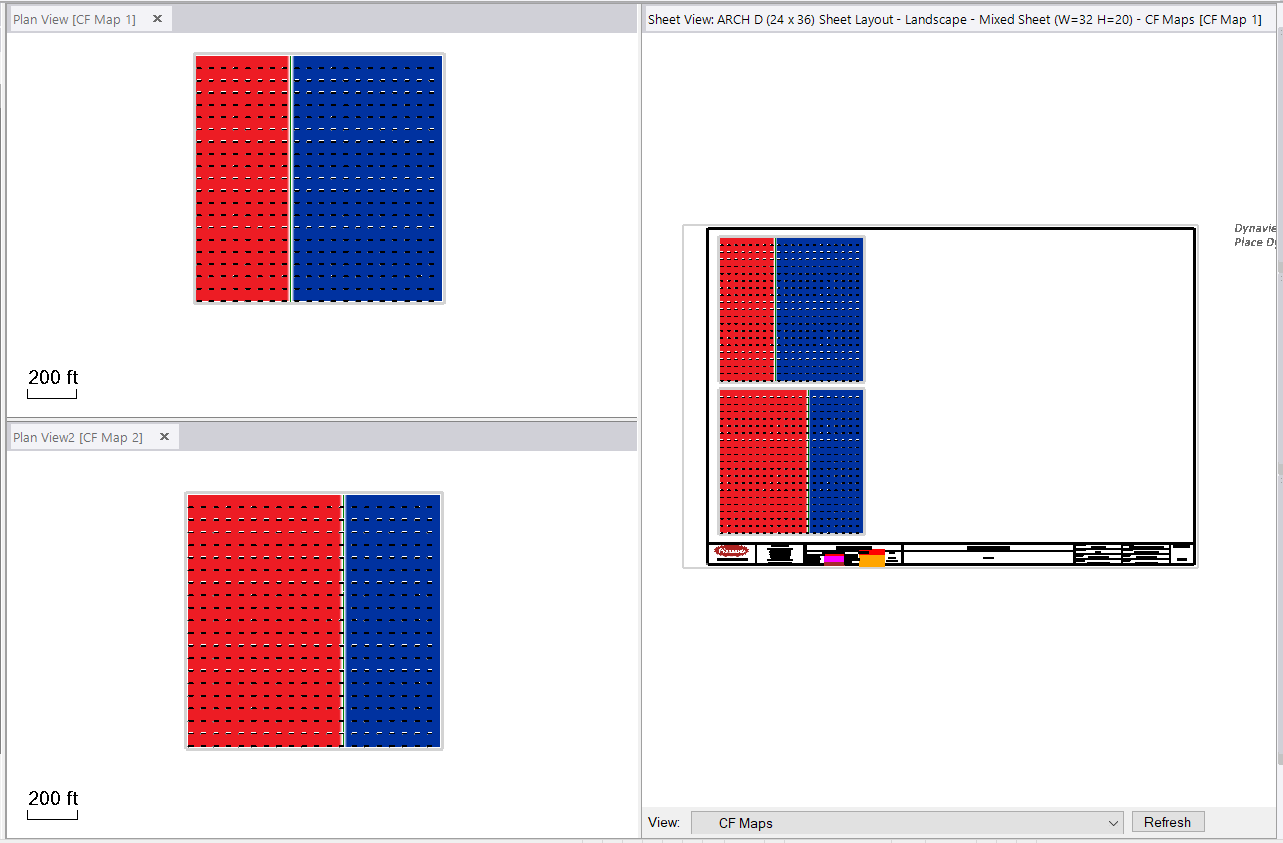
    8. I then created a Dynaview for CF Map 1 on the custom drawing sheet - on creation I selected the View Filter CF Map 1 (You can change this through properties of the Dynaview on the Sheet layout)
    9. I then created a Dynaview for CF Map 2 on the same custom drawing sheet - on creation I selected the View Filter CF Map 2 ()you can change this through properties of the Dynaview on the Sheet Layout


    At this point my Project looks the same as yours I think (in principal)


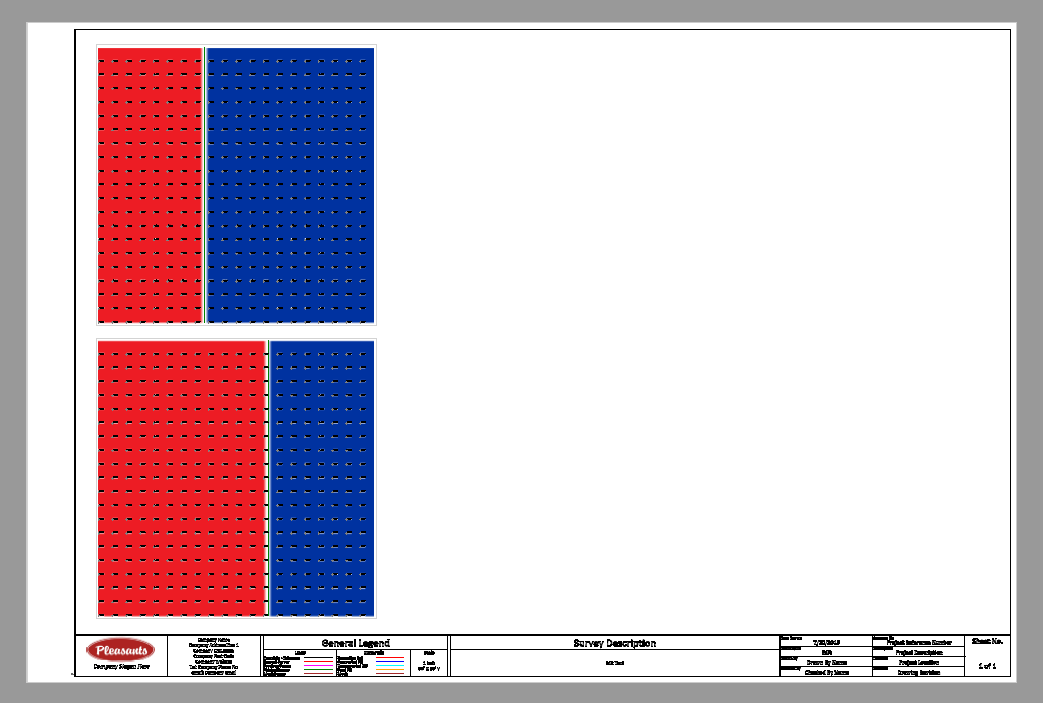
    Now I Print Plan Set - I select the Mixed Sheet Sheet Set and the CF Maps Sheet that I created as a custom Sheet


    I select Print to PDF and this is what I get in the PDF File - this is what you wanted I think - I have the All View Filter set in my Sheet View but it would have worked with CF Map 1 or 2 View Filter also as that includes all of the Sheet Layout stuff as well as the specified CF Map data. I dont think that is the issue here but it may be - make sure that each view only has one of the CF Maps in the View Filter applied to the Dynaview and make sure that ALL View Filter is applied to the Sheet View itself - it could be that both your Dynaviews are showing both CF Maps, but the display priority is winning to show only one or the other and that may also affect what comes out to the PDF Output.


    I did not place the legends on mine but that is an easy addition and I am sure makes no difference here.


    Hope that this answers the question


    My example and the PDF Output is here if you need to take a look at it


    Alan

    Attachment(s)


  • 3.  Re: Workaround for plot problems?

    Posted 01-04-2019 15:41

    My problem is that i am doing it just as you describe it. I think i also published a video about this earlier. Magnus also had the same problem in a project and he desbribed it the 28 november in the community. Last time i i wrote about it it was in another project and then i had to send my customer a plot that was not correct. Some things in one of the plots showed a surface that was not visible in the viewfilter but it still showed up when i plotted the pdf and i couldnt take it away, its the same thing now. i cant get the correct things to be showed when i plot it.  


    If you look at my pictures in this post you can see what it looks like in the drafting views and you can also see that it does not look the same when i plot it.

    The 2 C/F maps are not visible in each others viewfilters and has no priority. Magnus has the same trouble in some projects.

    This is really strange, this is my second project doing like this and now it is on another computer to, my surface pro and not on my standard computer. 


  • 4.  Re: Workaround for plot problems?

    Posted 01-04-2019 15:50

    Can you share your project - without that I cannot assist further or

    validate that we have a problem or not - since I did what you are trying to

    do and it worked, there must be something strange with what you are doing

    or with your data - if I can take a look I may be able to see where you /

    we are going wrong here


    Alan


    On Fri, Jan 4, 2019 at 3:41 PM fredrik@fredriksmarktjanst.nu <


  • 5.  Re: Workaround for plot problems?

    Posted 01-04-2019 16:30

    Can you dowload all of the files from here? I am right now on a cruise ship with a bad internet connection. 


    Dropbox - Högsbo - Simplify your life 


  • 6.  Re: Workaround for plot problems?

    Posted 01-05-2019 20:14

    Fred

    I took a look at your project, the reason that the two views are looking the same is because you used the same plotbox / dynaview frame for both views - when I copied the frame and used the copy as the source of the second dynaview, the plot came out correctly - this was a new one on me as well )we all learn every day I guess and I will discuss this with Development on Monday as I think this is a defect that the Sheet View shows what you expect yet the output is wrong - I hope that I can get that addressed ASAP (maybe in the patch that is pending).


    Anyhow - the work around is to create a different Plotbox / Dynaview Frame for each view that you want to create and then it appears to work well.


    Here is the PDF that I created using this method


    Thanks for asking this question


    Alan


  • 7.  Re: Workaround for plot problems?

    Posted 01-06-2019 06:52

    Alan

    The pdf you created is exactly what it should look like.

    Thanks for solving this one Alan, this has been a big problem for both me and magnus@fmtmark.se">Magnus Bengtsson for some time. 

    The only thing that bothers me is that i should have been able so solve this one by my self. 


    Im leaving Cuba this afternoon and are back in sweden on thuesday and then its time to start working again.


    Have a great sunday!


  • 8.  Re: Workaround for plot problems?

    Posted 01-23-2019 12:12

    Hi again!


    Strange, i still have this problem and maybe someone can help me. I cant find why things are showing up in pdf:s again but it don´t show in the dynaview. I have now made one separate plotbox for each dynaview but it does not help, the pdf:s still comes out wrong. The photos are showing how it looks in the plotview and how the same view looks in the pdf. The first pic is in tbc and the second is the pdf. its total 3.

    When i klick on the dynaviews i also get a strange box under my plotbox (Also posted a pic with this) anybody know what that is and maybe that is the problem?

    Thins not showing in plotview shows when plotted - YouTube 


  • 9.  Re: Workaround for plot problems?

    Posted 01-23-2019 12:22

    The strange box are the actual limits of the SUrfaces or Ortho Images that

    are included in the Dynaview - and nothing to worry about (confusing Yes as

    I had the exact same question).


    The issue with not plotting correctly, I thought I had the fix for that and

    it worked for me, and I have shared the problem with development as well as

    your data - I dont know where they are with that  though


    Alan


    On Wed, Jan 23, 2019 at 12:12 PM fredrik@fredriksmarktjanst.nu <


  • 10.  Re: Workaround for plot problems?

    Posted 01-23-2019 12:28

    Ok, thanks for your fast answer!

    Here is this project if you or the developers want to look at it, it has different plotboxes for every dynaview. 

    Dropbox - Kareby Förskola - Simplify your life 


  • 11.  Re: Workaround for plot problems?

    Posted 01-24-2019 07:06

    I have the same problem.:)