When you import Point Data it can be classified into one of the following
Control (will be drawn as a Triangle)
Survey (will be drawn as a Circle)
Mapping (Will be drawn as a Circle)
Unknown (Will be drawn as a Circle)
CAD Point (as created using the Create from CAD command) (Will be drawn as a dot)
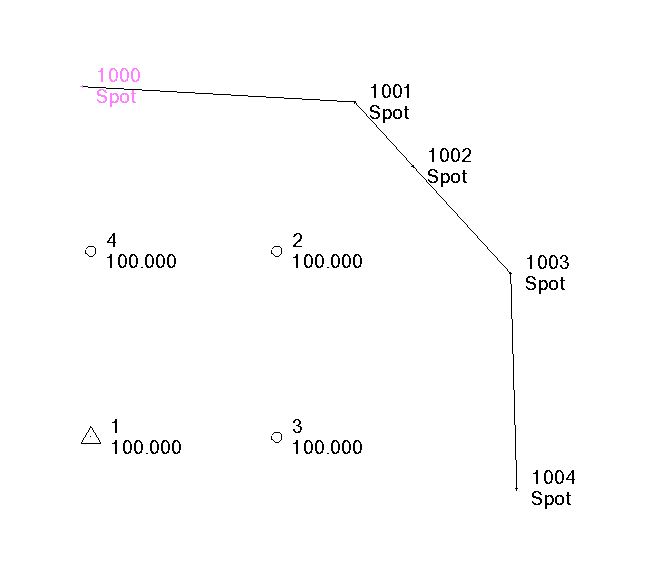
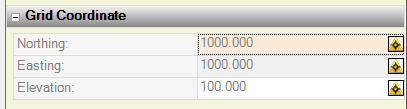
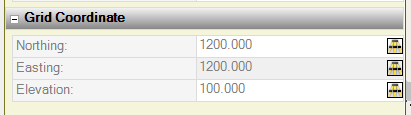
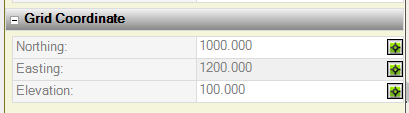
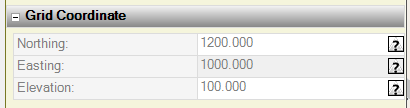
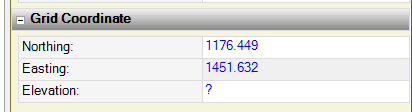
When you look at the properties of the different points you can see their "Quality" in the Grid Coordinate fields based on the icon associated with the Northing, Easting and Elevation values)
Point with Control Quality (1)
Point with Survey Quality (2)
Point with Mapping Quality (3)
Point with Unknown Quality (4)
CAD Point (1000 - 1004)
When you use the importers to bring in data, the P,E,N,Z,D type importers (or any custom format importer, you can define what Quality of Point you are bringing in (see the bottom right corner of the dialog below)
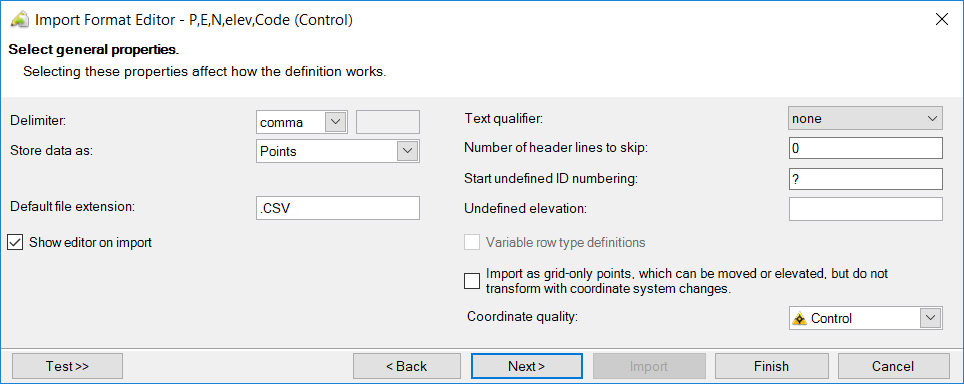
When you use other Importers like LandXML or DXF / DWG we will bring the point data in as CAD points most typically. The same applies for the Station, Offset Elevation importer.
You can then Label Points and that allows you to add a Symbol on all of the Points from a selection of symbols (ASCII Symbol Characters).
You can also Process feature Codes (or process an SPJ File as it is imported) and that will auto place Blocks and Symbols based on your Feature Definition File. Typically for SCS900 points we use the CAD Point style for the imported points. For the SCS900 Office Control Files - we will display the Points as Control Quality (with the Triangle) but the position will be Control Quality and the Height for Local and Global will be Survey Quality. For the GPS Points from a CAL file they will be displayed with the Circle and the Survey Quality for Grid, Local and Global Coordinates.
I hope that this answers the question. There is a logic to it all - you just have to know it ...
Alan