When you are using BC-HCE it depends a little on your licensed modules. If you have the Advanced Drafting Module you can easily create Plan, Profile, Section, Plan Profile and Mixed Sheet output to scale including any type of data and including images e.g. 3D Views etc or Site photos on a sheet. I will load a couple of examples for you to take a look at. When plotting you can plot to PDF or a Printer / Plotter to create the outputs that you need.
If you don't have an Advanced Drafting Module then there is a simple Print command that can drive a printer or you can redirect the Print output to a PDF file using a Print to PDF Driver but this approach is very limited in comparison to the Advanced Drafting Module.
The Advanced Drafting Module allows you to set up your Sheet Layouts with Title Boxes that can be filled out using Smart Text. It will automatically create you all of your Cross Sections and Profile drawings fully annotated and allows the plotting of e.g. Utilities or other critical features like overhead cables or bridge crossings etc in the Sections and profiles.
If you need to look closer at this let me know and we will get you a demonstration - I will post a video today and then update it later in the week as I am recording new videos this week.
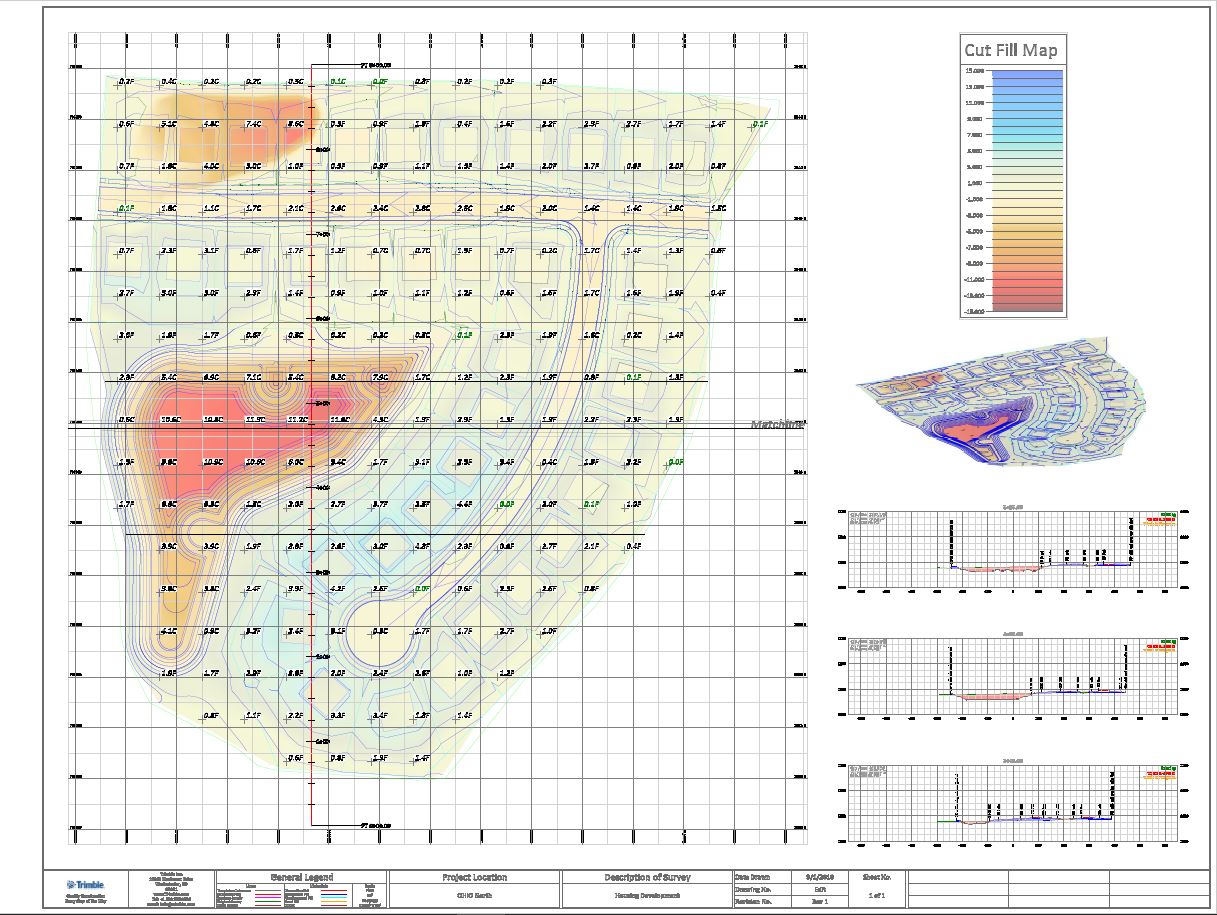
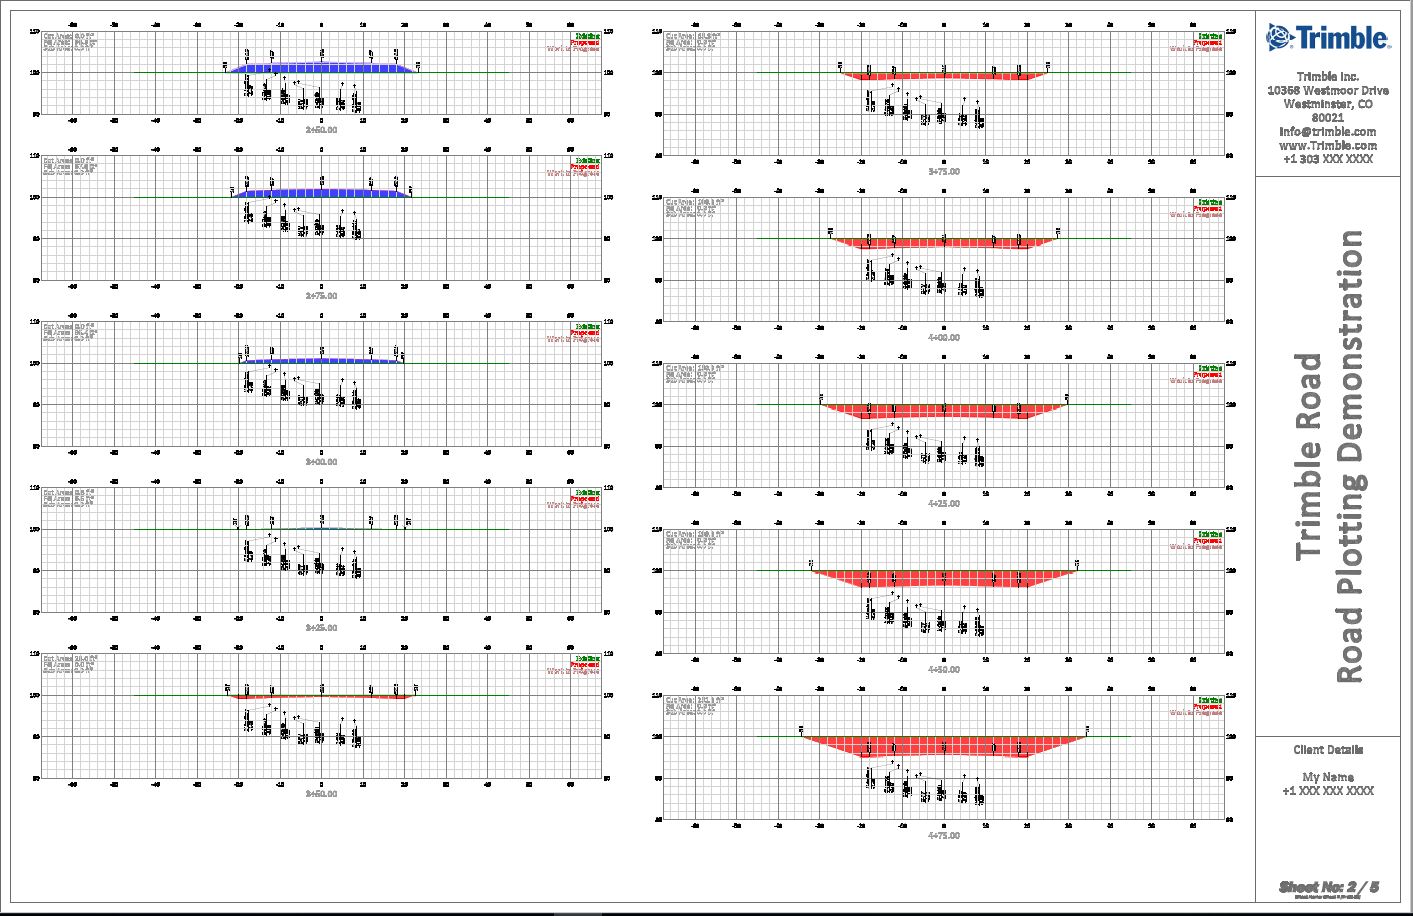
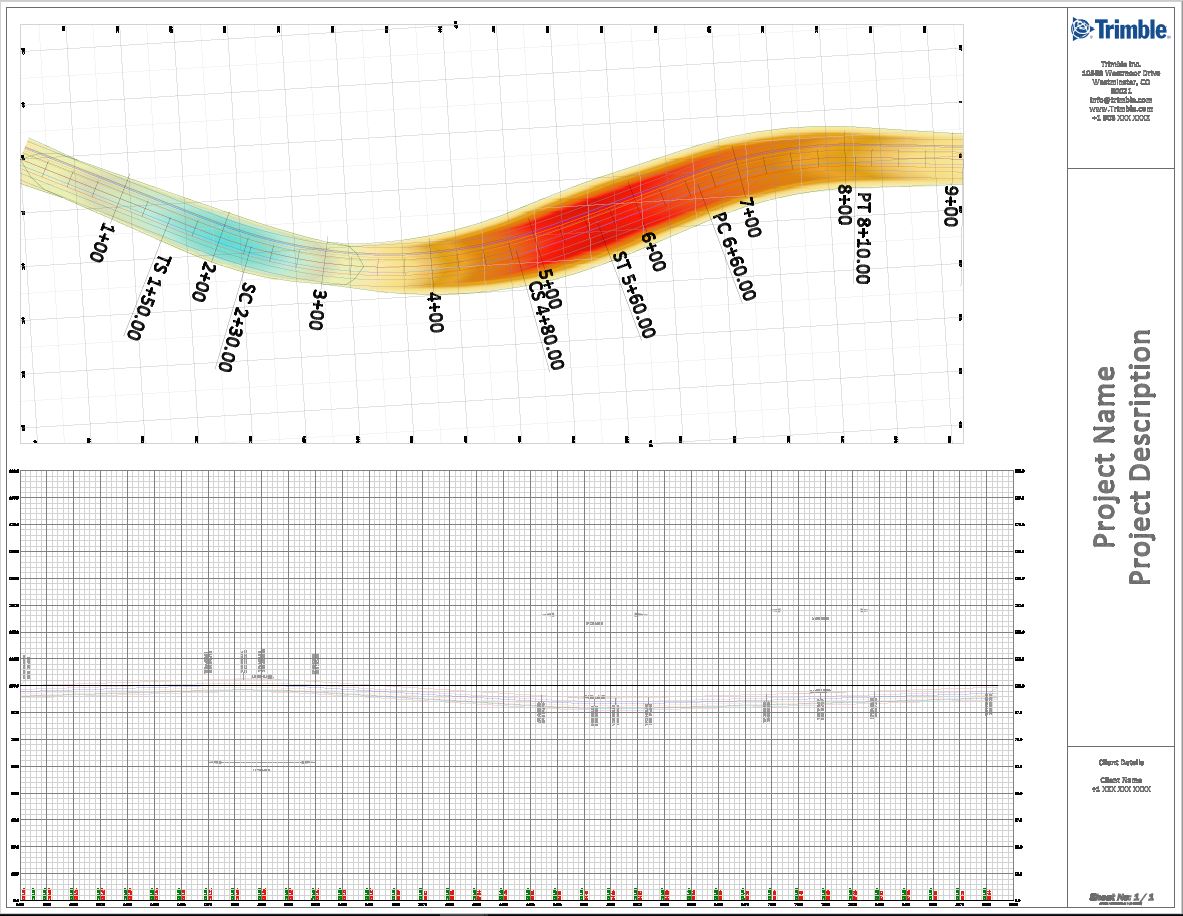
These can all be generated in a few minutes from a completed project - the video shows the process
Hope this helps - email me at alan_sharp@trimble.com if you have further questions
Alan