You are not restricted to just one offset on Left and Right - that is the limits of the reporting to Left and Right (i.e. you have a HAL plus a TIN that is say 1000' Left and Right of CL but you only want to report out as far as +-50' from centerline. These settings limit the width of the report.
You can have as many offsets as you want to report - you just have to draw them - the benefits of this approach are
1) The lines don't have to be at a constant offset
2) The lines can be named - that drives naming in the report
3) The lines are there so you can report at the exact same offsets over and over as surfaces are constructed / work progresses
Use the Offset Line command to create the Offset Lines and the Change Elevation command to elevate them to the reference surface elevation - this takes a few seconds before running the report.
We took this approach rather than the define up to 6 offsets - what happens if you have 7 offsets that you want to chase? Both methods have their merits, both methods deliver similar results.
If you have a Template that defines the locations to report you can also use that to define the offset locations - On Road Projects that is often the case of course.
If you survey Points and lines and want to report those against a Surface you can also do that with this same report
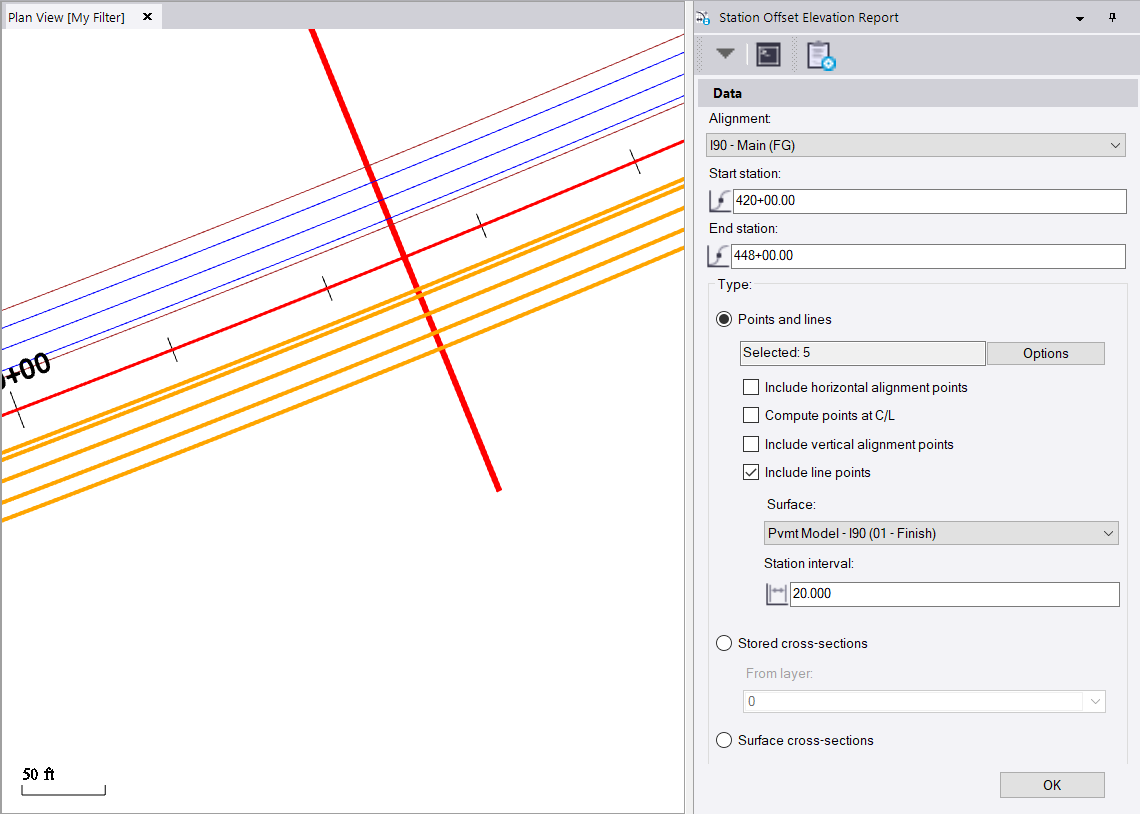
With this setup below, I have a Surface Model (Turned Off), The highlighted Lines (that are the offsets that I want to report on), and the settings using the Main Alignment, the Report Station Range and Interval and the reporting of the "Line Points" that will pick up additional changes in direction of the lines e.g. if they are not constant offset lines. If the lines are 2D I will only get the Station and Offset of the lines, but if the lines are elevated to the reference surface (or elevated by other means), then I will get their Elevation and Delta Elevation to the reference surface. I think in your case at these offsets at the station intervals you want the Elevations of the reference surface right?
This is the report I get back - each line is the same - I just filtered to IEOP here to show you those entries
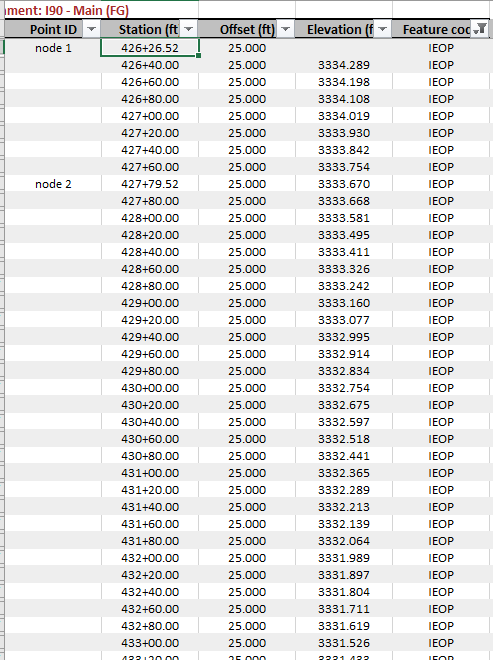
In this case I do not get any added nodes from where the station interval crosses a Triangle edge, all my reported items are named (based on the lines selected which I can reuse over and over each week I do a progress Survey or my final As Built Survey). Where no elevation is reported, the surface actually starts fractionally after the start of the lines drawn so the first node will have no elevation values.
If my lines are Surveyed Lines and have a Z value different to that of the reference surface then I will also get a Delta Z column between the Measured Line and the reference surface etc. My offsets would then also be the measured offsets not a design offset etc.
While I can see that entering a random number of offset values to generate an identical report is a different approach to the same problem, and like all things software could be beneficial to have that as an option, I think this approach works and gives good results today.
With it being an Excel Report you can easily hide or delete columns, and can put filters on the headers to reduce the data to show what you want to see. You can also sort by Feature Code to get all like features together or by Station and offset to group the data by Station range etc.
Hope that this helps
Alan